Image Processing 7. Histogram
3 min read June 19, 2025 #image processing #javascriptImage Processing 1. Introduction
Image Processing 2. Simple transformation
Image Processing 3. Negate filter, channel extraction and inversion
Image Processing 4. Desaturation
Image Processing 5. Color Models
Image Processing 6. Brightness, saturation, contrast, gamma correction
Image Processing 7. Histogram
Image Processing 8. Image scaling
Image Processing 9. Blur
Image Processing 10. Convolution Kernel
Image Processing 10. Convolution Kernel
Today's article is about histograms. I'll cover what histograms can tell us about a photo, how to construct histograms, and how image adjustments affect their appearance.
![]()
In the RGB representation of an image, there are 256 brightness values per channel. What if we count the number of pixels for each of these values? We would obtain some statistics about the brightness distribution, allowing us to determine which brightness levels predominate in the image and which are not. This is precisely what an image histogram represents.
If we count the values of each color channel as if it were a single channel, or convert colors to grayscale and then count the statistics, we get a luminance histogram. It indicates whether a photo is underexposed or overexposed. Thus, we would need to compensate a brightness level during post-processing or adjust exposure during shooting.
If we plot a graph for each RGB component, we get an RGB histogram. It reveals which color channel dominates in the image, enabling corrective actions. For instance, if the histogram is generated by the camera during focusing, a red-dominated histogram might suggest adjusting the white balance toward cooler tones. If the histogram is generated during post-processing, color channel clipping can be compensated using appropriate color filter.
But enough theory, let's move on to practice.
Generating a Histogram#
We'll draw the histogram on a canvas. First, create an array of 256 elements and fill it with zeros. Then count occurrences of each component value:
;
for ; i < src.length; i++
Next, find the maximum value to fit the graph to the canvas height and, of course, draw the lines:
;
for ; i < 256; i++
;
;
;
;
ctx.lineWidth = dx;
ctx.fillStyle = "#fff";
0, 0, canvas.width, canvas.height;
for ; i < 256; i++
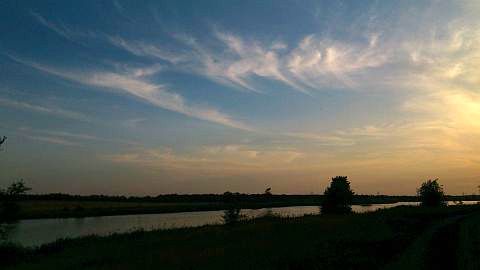
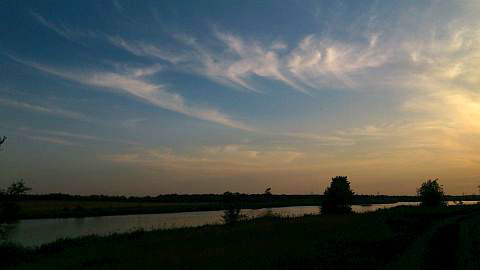
Let's take an ordinary photo:
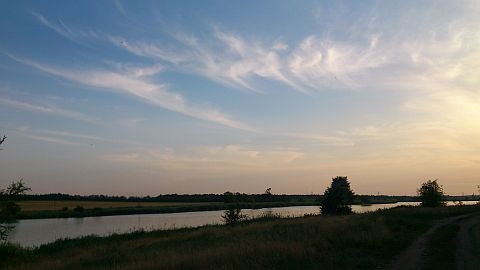
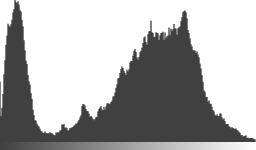
From this histogram, it's clear that the image is quite contrasty, with both dark and light tones present.
Here's the same scene at -2.0 exposure:
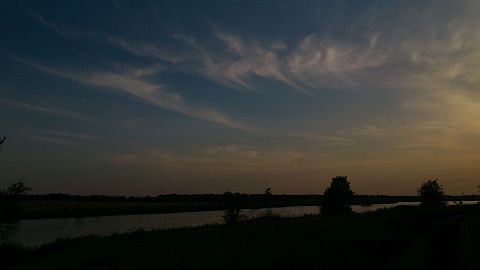
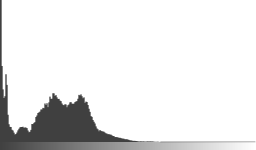
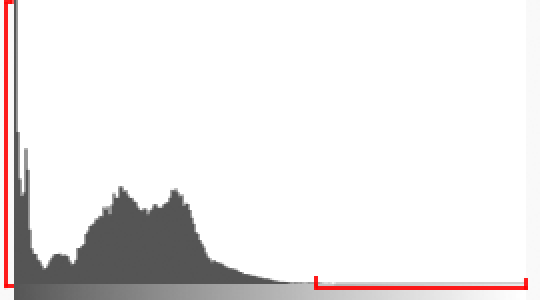
The histogram shows that there are almost no light areas here, and the large peak on the left indicates that the photo is underexposed.
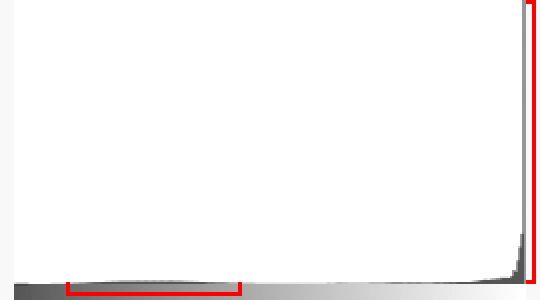
Finally, a photo with +2.0 exposure:
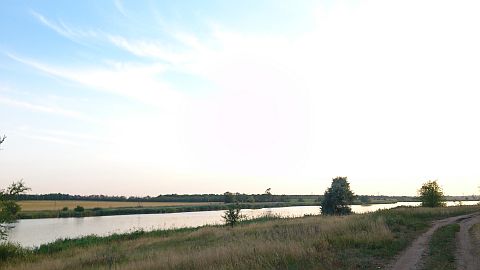

There's so much overexposure here that the midtones on the histogram are almost invisible, everything has shifted to the right edge.
Fixing the image#
We'll use the brightness/contrast adjustments from the previous article and see how the histogram changes.
As you can see, brightness shifts the histogram left or right, while contrast narrows or widens the range.
If we adjust the parameters so that there's no empty space on the left and right and there's no significant underexposure or overexposure, we get a slightly more acceptable image:
This's the principle behind the Auto Contrast correction in Photoshop:
The result is almost the same as with manual adjustment in JavaScript.